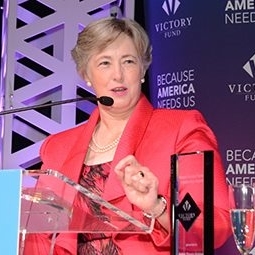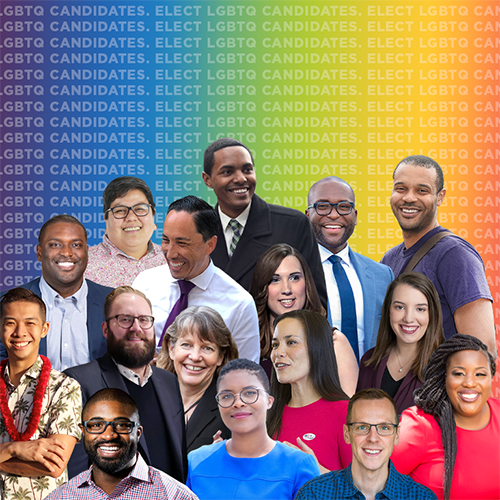
“LGBTQ Victory Fund is pleased to present you with our inaugural Out on the Trail report – which analyzes the diversity of the openly LGBTQ candidates who ran for office in 2020. More than 1,000 LGBTQ people ran this election cycle – the most in U.S. history – and we expect an unprecedented number to win on Election Day. This report will show that LGBTQ candidates are significantly more diverse than the overall candidate population, but that we have work to do to ensure LGBTQ candidates are as diverse as America. I hope you enjoy exploring the LGBTQ people who stepped up to run in 2020. You can see all of our active endorsed candidates at victoryfund.org/ourcandidates.”
– Mayor Annise Parker, President & CEO of LGBTQ Victory Fund
October 2020
A Note on Report Navigation: The graphs in this report are interactive both on desktop and mobile. To highlight a particular category and see the numerical values, select or deselect categories in the legend. The data for each graph can be downloaded by clicking on the icon on the bottom-left of each graph.
2020 Overview & Key Findings
At least 1,006 openly LGBTQ people ran or are running for office in 2020 – the most in history – and a 41 percent jump since the last midterm election in 2018, when 716 openly LGBTQ candidates ran. At least 574 LGBTQ candidates will appear on the general election ballot in November, up from 432 in 2018, a 33 percent increase.
Among the key findings:
- 31 percent of LGBTQ candidates running in 2020 identify as people of color, with the LGBTQ candidate population continuing to be significantly more racially diverse than the general candidate population.
- LGBTQ men of color are running in numbers proportional to men of color in the overall U.S. population in 2020, yet LGBTQ women of color are running at rates just half their proportion in the U.S. population.
- The proportion of bisexual and queer candidates in the total LGBTQ candidate population grew significantly from 2018 to 2020, but the proportion of lesbian candidates dropped.
- The number of transgender people running for office decreased between 2018 and 2020 (from 48 to 34), yet the number of genderqueer/non-binary/gender non-conforming candidates increased dramatically (from six to 25).
- Alabama is the only state where zero known openly LGBTQ candidates ran in 2020, while California, Texas and Florida were the states with the greatest number of LGBTQ candidates running.
- Victory Fund’s 2020 endorsed LGBTQ candidates are slightly more diverse than the overall LGBTQ candidate population in 2020.
LGBTQ people ran for office in 2020
increase in LGBTQ candidates between 2018 and 2020
or more LGBTQ candidates will be on the ballot in Nov. 2020
increase in LGBTQ candidates on the Nov. ballot between 2018 and 2020
Race & Ethnicity of LGBTQ Candidates in 2020
LGBTQ candidates are significantly more racially and ethnically diverse than the general candidate population in the U.S.* Thirty-one percent of LGBTQ candidates who ran or are running in 2020 identify as people of color compared to just 10 percent of all candidates who ran in 2018 (the last year with available data on all candidates who ran).
LGBTQ men of color are running in numbers proportional to men of color in the overall U.S. population – a significant finding – yet LGBTQ women of color are running at rates just half of their proportion in the U.S. population.** Both LGBTQ men of color and LGBTQ women of color run at rates significantly higher than men of color and women of color do generally.
of U.S. population are people of color
of all 2018 candidates were people of color
of LGBTQ candidates in 2018 were people of color
of LGBTQ candidates in 2020 are people of color
* The racial diversity of the total 2018 candidate population (including heterosexual, cisgender and LGBTQ candidates) is calculated in Reflective Democracy Campaign’s “The Electability Myth” report. 2018 is the last year for which this data is available.
** The “total candidate” data from Reflective Democracy Campaign only breaks gender down by “man” and “woman.” In this graph, transgender women are included in the “women” category and transgender men in the “men” category. Genderqueer, gender non-conforming, non-binary and intersex candidates are included as a third category. You can see a full breakdown of LGBTQ candidates by gender identity here.
*** Of the 1006 LGBTQ candidates identified in 2020, Victory Fund was able to determine the racial and gender identity demographics for 780. Of the 716 LGBTQ candidates identified in 2018 and 401 in 2019, Victory Fund was able to determine the racial and gender identity demographics for 588 and 341, respectively. All graphs and percentages are based on candidates for whom this information was found.
Sexual Orientation of LGBTQ Candidates in 2020
The majority of LGBTQ people who ran for office in 2020 were gay men with lesbians the second largest sexual orientation group. Yet both groups made up a smaller proportion of all LGBTQ candidates than they did in the midterm election in 2018. Bisexual, queer and pansexual candidates saw the greatest proportional growth since 2018.
increase in bisexual candidates between 2018 and 2020 (from 39 to 78)
increase in queer candidates between 2018 and 2020 (from 26 to 52)
increase in gay men candidates between 2018 and 2020 (from 332 to 401)
increase in lesbian candidates between 2018 and 2020 (from 192 to 204)
* Of the 1006 LGBTQ candidates identified in 2020, Victory Fund was able to determine the exact sexual orientation for 764. Of the 716 LGBTQ candidates identified in 2018 and 401 in 2019, Victory Fund was able to determine the sexual orientation demographics for 602 and 351, respectively. All graphs and percentages are based on candidates for whom this information was found.
Sex and Gender of LGBTQ Candidates in 2020
The proportion of LGBTQ candidates in 2020 who identify as cisgender men increased slightly since 2018 while the proportion of cisgender women decreased slightly. The number and proportion of transgender candidates decreased since 2018 but the number of genderqueer/non-binary candidates increased by 325 percent during that period.
increase in cisgender men candidates (from 341 to 445)
increase in cisgender women candidates (from 238 to 275)
increase in transgender candidates (from 48 to 34)
increase in genderqueer/non-binary candidates (from 4 to 17)
* Of the 1006 LGBTQ candidates identified in 2020, Victory Fund was able to determine the exact gender identity and expression for 782. Of the 716 LGBTQ candidates identified in 2018 and 401 in 2019, Victory Fund was able to determine the gender identity and expression demographics for 637 and 359, respectively. All graphs and percentages are based on candidates for whom this information was found.
2020 LGBTQ Candidates by State
LGBTQ candidates ran in 49 states in 2020 – with Alabama being the only state without a known out LGBTQ candidate. California, Florida and Texas were the states with the most LGBTQ candidates in 2020.
2020 Victory Fund Endorsed Candidates
LGBTQ Victory Fund endorsed candidates in 2020 were slightly more racially and ethnically diverse than the overall LGBTQ candidate population in 2020, with LGBTQ men of color endorsed at a higher rate than their proportion in the U.S. population. However, only 11 percent of endorsed candidates were LGBTQ women of color compared, despite representing 20 percent of the U.S. population. Just 10 percent of the overall LGBTQ candidate population in 2020 were LGBTQ women of color.
Victory Fund endorsed LGBTQ candidates of various sexual orientations and gender identities at approximately the same rate they appear in the overall LGBTQ candidate population, with the exception of cisgender women, which it endorsed at a slightly higher rate.
Key Takeaways

Victory Fund continues to make diversifying our pipeline of LGBTQ candidates a priority. LGBTQ people of color – and in particular LGBTQ women of color – face many barriers to running for office including sexism, racism, homophobia and transphobia. Transgender people – and in particular transgender men – face similar barriers that often prevent them from running.
Victory Fund is actively working to recruit and support candidates of color and trans candidates and is encouraging our donor network to invest in their campaigns. We also aim to amplify the voices of diverse candidates through our Spotlight Candidate program, which provides additional candidate services and fundraising opportunities to these candidates.
Victory Institute, our non-profit 501c3 organization, is working to diversify the pipeline of future candidates by ensuring our signature Candidate & Campaign Trainings are as diverse as our community. Our Victory Empowerment Fellowship, which provides candidates of color and/or trans candidates with campaign training, mentorship opportunities and access to our national network of LGBTQ elected officials, also aims to diversify LGBTQ candidates.

Support LGBTQ Victory Fund
LGBTQ Victory Fund works to achieve and sustain equality by increasing the number of openly LGBTQ elected officials at all levels of government while ensuring they reflect the diversity of those they serve.