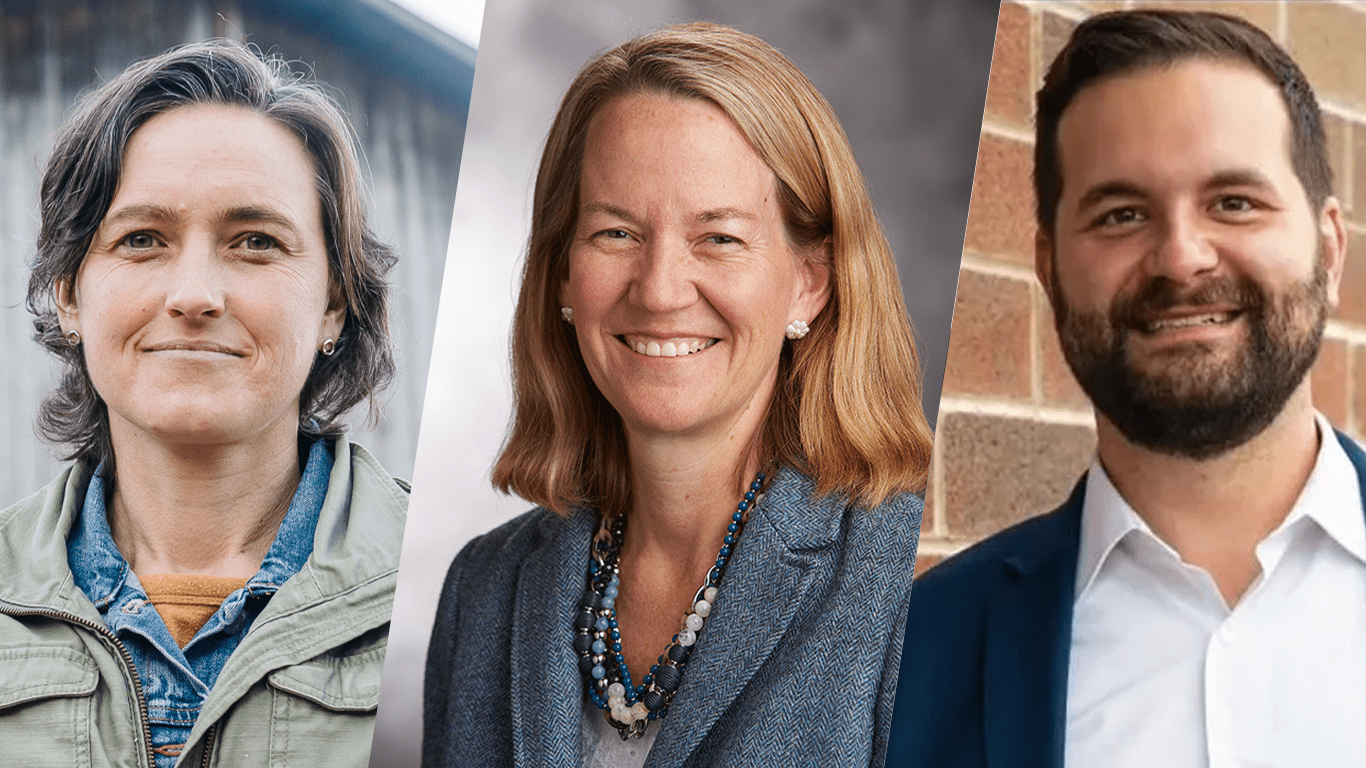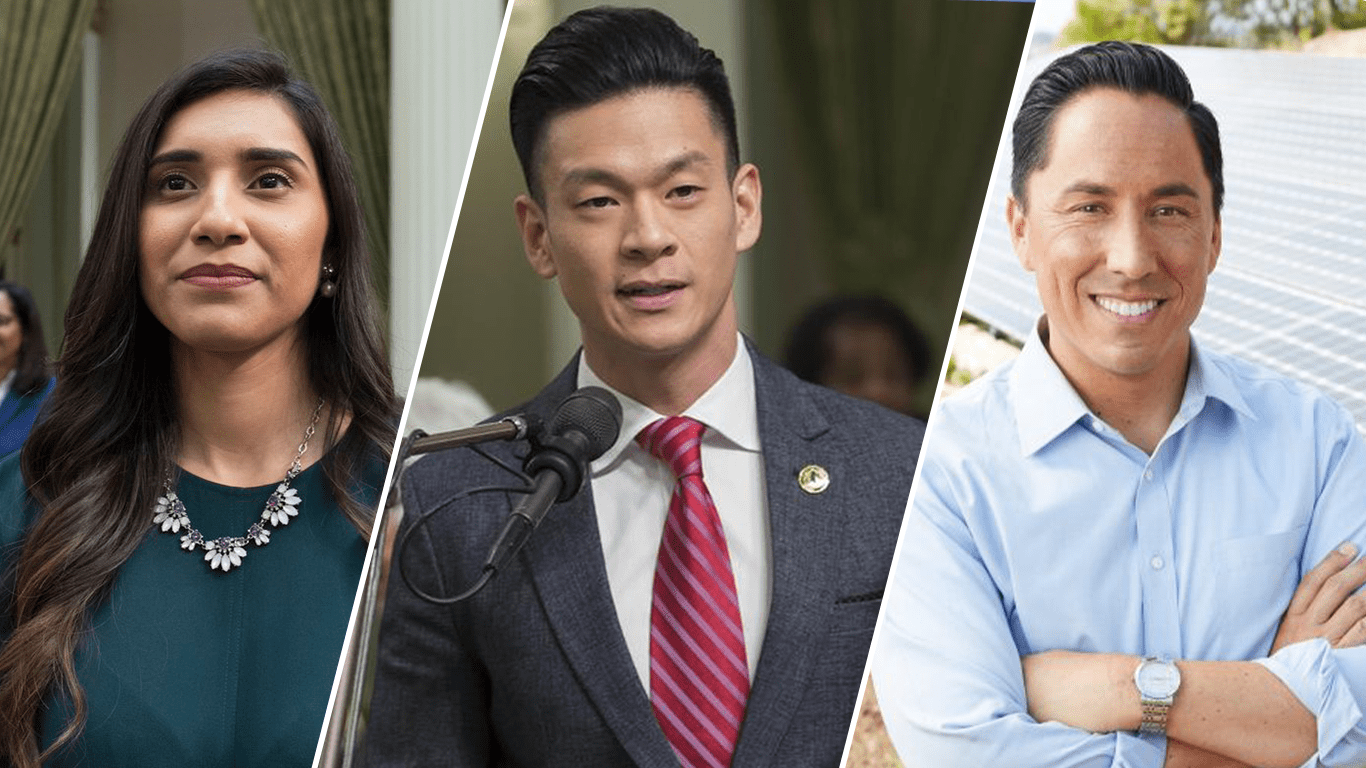
Today, we released the 2021 Out on the Trail report, which details the number and diversity of LGBTQ candidates who ran for office in 2021. At least 410 out LGBTQ people ran or are running for offices with elections in 2021, a 7.3 percent increase compared to the last odd-numbered election cycle in 2019, when 382 out candidates ran. Of the 410 candidates, 237 will be on the ballot in November, an 18.5 percent jump from 2019, the previous record for the number of LGBTQ candidates in an odd-numbered election year.
The full report, including all key findings and detailed demographic data and trends, is available at victoryfund.org/outonthetrail2021.
Forty-two LGBTQ candidates already won elections in 2021. To surpass the previous record for LGBTQ candidate wins in an odd-numbered election year, 128 or more of the 237 candidates on the ballot must win in November. The previous record was 169 LGBTQ candidates elected in 2019.
Among the other key findings:*
- 36 percent of LGBTQ candidates who ran or are running in 2021 identify as people of color, making them significantly more racially and ethnically diverse than U.S. candidates overall,** and the most diverse group of LGBTQ candidates in history;
- Women of color remain severely underrepresented among LGBTQ candidates, making up just 10 percent of LGBTQ candidates and four percent of candidates overall, despite being 20 percent of the U.S. population.
- Black LGBTQ candidates grew significantly between 2019 and 2021, with 17.8 percent of LGBTQ candidates (73) in 2021 identifying as Black compared to just 12.3 percent of LGBTQ candidates (47) in 2019;
- Asian and Pacific Islander LGBTQ candidates more than doubled, from five in 2019 to 12 in 2021;
- Genderqueer and non-binary candidates more than tripled (from five in 2019 to 18 in 2021) and trans-identified candidates increased from 19 to 26 (representing 6.3 percent of LGBTQ candidates in 2021);
- Queer-identified candidates more than doubled, from 25 (6.5 percent) in 2019 to 62 (15.1 percent) in 2021, and bisexual candidates nearly doubled, from 24 (6.3 percent) to 42 (10.2 percent) in 2021; and
- LGBTQ candidates ran or are running in 39 states – 81.9 percent for local positions.
“LGBTQ candidates are running in historic numbers and increasingly reflect the diversity of America, with more LGBTQ people of color, bisexual, queer and non-binary leaders choosing public service as the way to make change,” said Mayor Annise Parker, President & CEO of LGBTQ Victory Fund. “Next week, we have an opportunity to elect hundreds of LGBTQ leaders who can challenge the anti-LGBTQ forces influencing school boards, city councils and state legislatures across the country. As our community again faces a barrage of anti-LGBTQ bills at the state and local levels, it is imperative we elect LGBTQ people who can impact the debate and humanize LGBTQ issues for other elected leaders.”
The entire Out on the Trail digital report can be viewed at victoryfund.org/outonthetrail2021.
More information about all of Victory Fund’s endorsed candidates is available at victoryfund.org/ourcandidates. Since 1991, Victory Fund has helped thousands of openly LGBTQ candidates win local, state and federal elections.
* The findings compare data from 2019 with data from 2021 because both were “off-year” odd-numbered election cycles, a more relevant comparison point than 2020, which was a presidential year when significantly more positions were up for election.
** The total 2018 candidate population (including heterosexual, cisgender and LGBTQ candidates) is estimated to be 10 percent people of color, as calculated in Reflective Democracy Campaign’s “The Electability Myth” report. 2018 is the last year for which this data is available.


